


<a href=”http://technorati.com/claim/itn5q2t2p” rel=”me”>Technorati Profile</a>
Monday Morning – New Site Open
Posted by zmann on March 19, 2007
The new site is up and this morning’s post can be visited at:
Please come and see it and as always, thanks for reading!
Posted in Uncategorized | 11 Comments »
Final Friday
Posted by zmann on March 16, 2007
Friday Topics
- Intro
- Natural Storage Gas Review & Outlook
- Opec
- Snafu Watch
- Expiry – yawn
- Odds and Ends
- The end of zmann(.wordpress.com)
Intro : Oil failure day. What a disappointment. At $57.49 April crude is resting on my target. Next stop $55. – see further drivers of the decline in the Snafu Watch below. Stocks followed the market around until oil did a swan dive into the close. RBOB fell nearly a nickel on profit taking and a lack of hysteria. It’s funny how everyone expects gasoline and oil to rise after it’s been rising and now call for a fall the minute it starts dropping.
Natural Gas Storage Review. 115 Bcf in line with Street estimates (way above my 90).
- April Gas fell $0.12 on the news to $6.96.
- We have 1,516 Bcf in storage an average March will get you to 1,380 ish Bcf at the end of the month, vs 5 year average trough storage of 1,025 Bcf.
- There was no 12 Bcf adjustment to last week’s number. I got into it with the EIA and we were apples to oranges and I think their methodology is less than perfect for comparing YoY storage but whatever. I may or may not post a technical piece over the weekend. I’m probably the only one that cares at this point.
Next stop $6.50. I think we bottom between there and $6. It’ll be interesting to see what happened to the net short position when the CFTC data is released at 3:30 (or so) EST today. Recall that last week we dove back into net negative territory .
Opec Watch: Slam Bam See You In September. I’m not even sure the ministers sat down. No action taken in adjusting production quotas. Seems they’re thinking everything is slowing down too. In fact, given the “well supplied” state of the oil markets their unwillingness to increase volumes at this time speaks volumes about their confidence in the rising demand forecasts for 2007 and the ability of the markets to absorb more barrels anytime soon (well, at least through September).
Snafu Watch. Thanks to El Diablo for his continued quest for the truth. See the Snafu page for detrails but here are the highlights:
- Imperil Oil’s Toronto refinery is back up on schedule with prior guidance. This is one of those three legs of the stool holding up gasoline(although not in the US it’s close enough that it was making that region tight),
- regenerator restart at a VLO Houston refinery,
- Shell has regained access to a large leak in a Nigerian,
- Nigeria’s oil minister says he thinks all shut in production could be back on line by the end of the year. I’ll believe that when I’m there, on the ground, seeing it all flow.
All of these combined should pressure gasoline and oil prices today.Options Expiration Day. Expiry combined with March Madness should lead to a very dull day after the first few hours. No DTs today I promise. Too much good roundball on the tube.
Odds & Ends
Analyst Watch: nada
This is the end of zmann.wordpress.com. It’s been real and it’s been fun but after careful consideration I have decided to quit posting to my wordpress.com site. ZEB is moving to a hosted site which offers greater storage (my charts are taking up an unbelievable amount of space) and more flexibility. There’ll be a link posted here over the weekend and/or Monday morning and I’ll keep posting on this site for another week or so for those who’re slow to bookmark new things.
Many thanks to the guys at wordpress.com for a great free platform but I’ve got to grow!
Everybody have a safe trading day and a great weekend!
Posted in Uncategorized | 17 Comments »
Thursday – OPEC Meeting & Natural Gas Storage
Posted by zmann on March 14, 2007
Today’s topics
- Intro w/ oil and gas price action
- Natural gas
- Opec Meeting Watch
- Gasoline picture show
- Stock action (inaction in this case)
- Odds & Ends
What a whipsaw! All determined by the broad markets with neither the downdraft nor the updraft determined by oil which actually closed at $58.16 after a brief dip below the $57.50 level (my initial target for a pullback from last week). In fact oil trailed around in lockstep after the DJI most of the day which seems normal for an important sector in a choppy until you look at that same chart for the last year. Some credit also has to go to natural gas which retook the $7 level and inspired a small rally in the gassier E&Ps.
I said this in comments yesterday: It [natural gas] did so after the heating oil number came out which was bigger than expected. The expectation is that a big HO draw today means a big gas draw tomorrow. Not always true. The HO relationship with temps is not as linear as is the relationship between gas and temps. I think this rally in nat gas gets reversed tomorrow. Comment: I stick by that.
Natural Gas Inventory Day
- My expectations: 90 Bcf. Degree days were roughly identical to the prior week (in aggregate) when we got a 102 Bcf withdrawal. Of that number 12 Bcf was a database adjustment.
- Note: the EIA’s file ng_stor_wkly_s1_w.xls located here does not yet reflect year ago figures from the weekly natural gas report here. I have emailed them to update the database. When they do I’ll update the gas storage page.
- Street: range of 80 to 140 Bcf, consensus was unknown at the time of this post. I’d bet the over under is 100 Bcf. Below that and you slip towards $7 immediately. Above it and gas may get a small reprieve…say a day or two at most before it again heads toward $6.50.
- The reason is simple: degree days are expected to fall by nearly half this week. I won’t surprised to see another burst of cold make for choppy trading but I still expect to see lower prices in the second half of March and early April setting up a good buying opportunity in the quality, gassy E&P names prior to summer’s heat and hurricanes.
If we get a 100 Bcf number today and average withdrawals for the remainder of March we’re likely to bottom out with more than 1,400 Bcf in storage. Well above the five year average of 1,232 Bcf but well below last year’s 1,692 Bcf number.
OPEC Watch: The ministers begin the first of a two day meeting today in Vienna. I’ll update in the comments section.
Gasoline Picture Show. We received little help from yesterday’s inventory report in hobbling the 3 legged stool upon which high gasoline prices rest. Utilization continued to slide although according to the companies that’s about to reverse, imports ticked up but only just, and demand ebbed but also only just. Hey, if demand and imports move in the same direction next week (down and up respectively) the stool should start to wobble a bit under the weight of $0.40 of gain in RBOB prices since mid January.
Extended maintenance and snafus are keeping utilization low

Imports may be trending lower but this is after running high to historic norms.

From EIA’s comments yesterday: gasoline imports have also dropped, falling below 1 million barrels per day the last six weeks after averaging 1.15 million barrels per day in 2006. After receiving a lot of gasoline imports earlier in the season, gasoline stocks are relatively low in Europe and refinery maintenance has begun there as well, just as other parts of the world see an increasing need for gasoline. As a result, the arbitrage for shipping marginal gasoline supplies from Europe to the United States diminished considerably, further limiting imports.
Demand actually fell slightly from a week ago but remains elevated for this time of year.

Two charts straight from the EIA’s weekly are very telling of just how much of a rise we’ve seen in gasoline prices this season:


Wow…With Price Action Like That Inventories Must Be Very Low. No, they’re still above average. So what do you think happens if we’ve gotten the pre driving season rally already out of the way and refineries start coming back into service?

Holdings Watch: I took a little TSO put position yesterday – May 90s puts between $3.40 and $3.60 (average is close to the top unfortunately).
Odds & Ends
STEO Watch: If you don’t read the EIA’s short term energy outlook you should. Here’s the link. The price estimates move around as oil and gas prices do and I’ve found them to be utterly worthless beyond the next few weeks in predicting price. No offense meant but they stick pretty close to current prices with an eye towards what’s happened in terms of direction over the past month. However, the data they keep up with is phenomenal.
Briefly, they expect the OPEC surplus to increase in 2007 and 2008 to 2.0 mm bopd from 2006 levels of 1.3 mm bopd yet they expect oil prices to be up relative to last year on higher demand in 2007 and again in 2008. This is inspite of the fact that early year demand came in lower than expected and that non-Opec supply is growing faster than expected (Caspian Sea, Russia, Africa, Brazil, and even the United States). That’s a head scratcher. Growth in demand is expected to slow as well. Hmmm.
And here’s their thoughts on gasoline inventories:
Total motor gasoline stocks are projected to be at the upper end of the normal range throughout the forecast period. Nevertheless, continued demand growth pushes inventories (measured in terms of days‐of‐supply) steadily lower, setting the stage for an increase in gasoline margins and retail prices. Comment: Who do these guys work for? I mean, steadily lower? That’s the red line in the last graph. Does that look steadily lower, especially given the season? These are smart guys but sometimes you’ve got to stop contradicting yourself or trying to make the data fit the scenario and just say things don’t make sense, are irrational, overblown etc, etc.
Analyst Watch: I’ll update in comments.
END Watch: Back down to $2.11 after 2 days of very little volume. To me this one is fire and forget (or at least check infrequently). Either way I hate to be that guy at the poker table who only points to his recent gambles when they’ve immediately paid off.
Posted in Uncategorized | 64 Comments »
Wednesday Morning – Oil Inventory Day
Posted by zmann on March 14, 2007
What’s driving gasoline prices higher? RBOB is up $0.40 in the last two months. A confluence of three events are forming what the MSM habitually refers to as a perfect storm: low refinery utilization, low imports, and strong contra-seasonal demand. I prefer to think of gas prices as sitting on top of a three-legged stool. Solve any of the three problems and the crushing weight of above average gasoline inventories brings prices toppling down.
- Utilization Is Depressed By A Plethora Of Snafus. The first is the unusually low levels of refinery utilization the US is experiencing at present. We’re in the first of two maintenance seasons for the year and things haven’t gone well. At present utilization is only 85.9% (below the three year average of 88% but above last year) due to several high profile refinery fires and extended maintenance cycles at several large facilities.

- The second factor is falling finished products imports. This is a function of: 1) logistical issues with the the Houston Ship Channel and 2) reduced tanker loadings. As you can see in the following chart, gasoline imports have been declining in recent weeks during a period in which they are normally rising. This is worth close monitoring since a reversal here could quickly lead to a reversal in gasoline prices.

- Demand has been unusually strong year to date. Enough said, it’s true. People buy more gasoline when it gets close to $2 per gallon and they have very short memories.
The relatively low levels of gasoline production and the reduced imports with three months left until the beginning of the U.S. driving season have induced a panic stricken atmosphere in which reality and perception have diverged by a country mile.
- The sad thing is is that the mainstream media portrays the situation as especially dire despite the fact that gasoline inventories, at least before today’s report remain above the average range. If you don’t believe check out the energy portion of our site today to see a nice set of graphs pull directly the government showing current gas and oil stocks.
- My Thanks to El Diablo for his vigilance as he posted a great set of headlines portraying the rocky situation with Nigerian rebels and the threat posed by Iran’s nuclear defiance. The funny thing was that those headlines were from March of 2006! Even the accompanying stories could have been complete cut and pastes.
The Truth is that inventories remain above average, not just crude but gasoline and heating oil (need proof?) and my sense is that as the snafus sort themselves out we’re headed for a test of the $55 level in the near term, say 1 to 2 weeks, unless today’s numbers show a significant decline in crude again or the gasoline number is just atrocious…something over 2.5 mm barrels.
Oil: Down nearly $4 in the last four days .In my book, yesterday’s failed attempted to retake $60 translates into the statement, “what was support now becomes resistance.” Now more than ever I think we make a move on $57.50 and then $55. Inventories, if hinky, could give a bit of a boost but the writing is on the wall between moderating weather, a gasoline situation which is at just about the worst I can imagine right now and an OPEC meeting where nothing will happen.
Expectations from a variety of surveys for today’s inventory report looks like this:
- Crude: up 1.9 to 2.0 million barrels. The alleviation of the supply bottleneck at the Houston Ship Channel should help bring this number back into positive territory after last week’s surprising withdrawal.
- Gasoline: down 2.45 million barrels. Should this number come in as expected gasoline inventories would still be above average for this time of year. A bigger than expected draw here would likely send crude back up over $60.
- Distillate: down 1.8 million barrels.…We could still get a big number here from secondary and tertiary demand sources but i’s unlikely to be oil price moving unless it doubles the expected draw.
- Utilization: rising to 86.3%.
So What Hasn’t Felt The Sting Of Falling Commodity Prices Yet?
- The refiners for one which are touted daily as the best buys on the planet despite the huge run the group has experienced since the beginning of the year. Crack spreads are up, no doubt about but the multiple expansion feels overdone here. When reformulated gasoline (RBOB) cools there will be some profit taking to say the least.

The rest of my put picks from Monday have performed pretty well. I know it’s only two days in a rotten market but the variances in the performance of the different categories (taken from Monday’s post) demonstrates that in many cases the sell off has been a thoughtful process and not just a “sell the sector” event. The damage has been worse where you would expect it to be: the higher cost producers.

Odds & Ends
OPEC Meeting Watch: No one expects them to do anything. Ministers from Qatar and Algeria have repeatedly commented over the last couple of days that no no further production cuts are necessary.
Analyst Watch: CVX upgraded at DB
Posted in Uncategorized | 36 Comments »
Tuesday Morning – Waiting For More Data
Posted by zmann on March 13, 2007
I’ll be brief today as everything from yesterday still applies and I have some site maintenance issues to attend to.
Oil: Down nearly $3 in the last three days . This morning oil is getting a small bounce back above $59. The early read on Wednesday’s inventory report calls for:
- Crude: up 1.9 million barrels. The alleviation of the supply bottleneck at the Houston Ship Channel should help bring this number back into positive territory after last week’s surprising withdrawal.
- Gasoline: down 2.4 million barrels. Should this number come in as expected gasoline inventories would still above average for this time of year. A bigger than expected draw here would likely send crude back up over $60.
- Distillate: down 1.8 million barrels.… And quickly receding into background as a current determinant of oil prices.
OPEC Watch: Waiting and Watching. Everyone expects OPEC to do nothing this week at their March 15 meeting in Vienna. Look for the words healthy and balanced to describe the current supply demand balance as long as oil remains above $57.50 through Friday.
Iran & Vladamir Watch: Russia scolded Iran for “abusing its goodwill” yesterday and announced “indefinite delays” in further technical assistance with Iran’s nuclear program. Vlad’s got them over a nuclear barrel.
IEA Maintains Annual Demand Numbers; Dumps The Front and Bumps The Tail. The International Energy Agency said it’s kept its global oil product demand forecasts virtually unchanged, at 84.5 million bpd in 2006 and 86 million bpd in 2007. World demand is estimated to have grown 1% in 2006 and estimated to rise 1.8% in 2007, the Paris-based energy agency said. The IEA revised lower first-quarter 2007 demand but revised higher fourth-quarter 2007 demand ~ from Marketwatch. Comment: The manipulation of the quarters to maintain the full year number seems odd in light of Greenspan’s 1 in 3 R word comments.
Natural Gas: Warm Weather Melts Gas Prices. Gas has been trading lower with warmer weather, plain and simple.
- Barring a serious cold snap this Thursday’s inventory report will probably be the last of the large gas withdrawals for the winter of 2006/07.
- CFTC data shows swing back to net short position.
-
- The net short position has fallen below May 2006 when gas traded at $6 and traders were beginning to accumulate a long position that would ultimately drive gas higher despite a large inventory overhang.
- This position will ultimately become a source of support for gas prices when traders begin covering (probably all at once when they see the first tropical wave coming off the West African coast that looks like it have any chance of organizing into a storm).

Holdings Watch: I’m sticking to my seasonal weakness guns and maintaining yesterday’s list of potential movers. Despite pretty good declines in crude and natural gas the stocks have been remarkably resilient and are more focused on the broader market’s ability to recover from it’s brief bought of Asian Flu.
Analyst Watch: RIG picked up as a buy at Matrix, EPL reiterated as an outperform but price target reduced from $30 to $24 at FBR.
Note to SA Editor: Let’s not publish today’s post. Thanks.
Posted in Uncategorized | 22 Comments »
Monday Morning – Weaker
Posted by zmann on March 12, 2007
Commodities Test Critical Support: Oil- $60, Natural Gas- $7.
- Oil: Falling. $60 Floor Failure. As the refining industry snafus sort themselves out and OPEC prepares to meet in Vienna oil is starting to retreat. I’m looking for a pullback to $57.50 and then into the mid $50s. Timing is critical. If crude falls through $55 early this week look for sharper rhetoric and even “promises” of production cuts later in the week from the more brash members. This could lead to some very volatile trading late in the week. It’s funny how it’s not all about the money and until it is all about the money.
- Natural Gas: Falling. $7 Floor Failure. After trading off $0.30 in the last three days of last week, gas repeatedly touched $7.00 in the overnight market, finally breaking through into the high $6s early this morning. This is gas’ lowest level since late January and it looks to me like we’re in for a bought of shoulder season weakness, potentially making a run on $6.50 in the coming week or two.
- Last week’s heating degree days were expected to be roughly in line with the prior week (177) which produced a 90 Bcf withdrawal (102 officially but that included a database adjustment.) As of 8 EST last week’s HDDs were still not posted so I’ll have them in comments later today.
- This week’s early read from the CPC predicts HDDs fall off a cliff to 106 numerically reflecting the following map.
Why all the commodity price weakness? Two words: Red Dawn.

The Week Ahead: Last week the stocks failed to track the commodities lower. I’ll be taking a hard look at new or additional put positions in stocks that are:
- elevated on the gasoline run: HOC, TSO, WNR, and VLO. The first quarter is going to be great true but a lot of that upside is already factored in to the large moves these stocks have all had.
- gassy and still conducting asset sales: APC
- gassy and bought more gas at too high of a price: COP
- gassy, buying assets today, and not as well hedged as it’s peers: CPE
- gassy, well hedged but looking toppy: COG, CHK, KWK, and SWN; warning: just a trade…great management, low cost producers, but susceptible to a slide in gas prices.
- higher cost producers like SGY and EPL which continue to break down after failing to get hitched last year. “Declining commodity prices” and “exploring strategic alternatives” are two phrases that don’t mix well.
- HES, MUR, and MRO.
- Check with Phil at PSW for options plays on these names.
Odds & Ends
I posted a mostly financial Addendum to the END report this weekend.
HAL Moves Headquarters to Dubai. Halliburton is also considering listing its shares on one of the middle eastern exchanges. Getting closer to state owned oil companies or further away from the Democrats in the nick of time?
Opec Watch: Opec meets Thursday. Everyone pretty much expects them to stand pat which means nothing if oil punches below $55 by meeting time. Opec is voicing confidence in oil prices with statements like the the one from Algeria’s oil minister this weekend, “oil prices will remain at their current level until the end of 2007 because of strong demand and Iran’s standoff with the West over its nuclear program” ~Upstream.
Refinery Watch: Two more fires over the weekend. One in Volgograd, Russia and the other at the Puerto La Cruz facility in Venezuela. No word on damage although the Russian thing looked pretty epic for a time. Probably limited impact on prices unless you’re in Cuba.
Analyst Watch: nada.
Posted in Uncategorized | 12 Comments »
END – Addendum – Moving In The Right Direction
Posted by zmann on March 11, 2007
The following post is an addendum to my book report on END from last Thursday (Endeavour Petroleum – One Interesting Little Minnow – March 8, 2007). The following are what I feel to be my best estimates with a strong leaning towards conservatism.
The production profile below incorporates my assumptions for reasonable estimates of field declines and the timing and rate of additions from sanctioned field developments from publicly available sources. It does not assume any exploratory success or additional acquisitions. It has not been sanctioned by the company although it shadows the graphic in my prior post which was the company’s publicly disclosed production profile.
Production Profile:

Note: My 2007 production is within current guidance for 2007 of 8,800 to 9,200 boepd despite: 1) current production (early March 2007) of ~ 10,000 boepd and 2) Enoch field production of ~ 1,000 boepd scheduled to come on-line in the second quarter. I’d always rather be able to take numbers up than be forced to bring them down and I’d like to see continued delivery on the promise of low decline rates for the acquired U.K. production base.
‘
Hedges:

Note: Oil hedges include swaption volumes.
‘
Summary: Moving in the right direction folks!

Price Deck:
2007 and beyond: $60 and $6 index prices held flat. I think this is pretty conservative, especially on the out year gas price.
Posted in Uncategorized | 2 Comments »
Friday Morning – I’ve Got That Neutral Feeling
Posted by zmann on March 9, 2007
Morning Comments: Flattish broader market (at least ahead of payrolls), flattish oil and gas indications. No picks today but a “Big Picture” picture show.
Yesterday saw slight declines in both commodities:
- April crude couldn’t hold on to a rally over $62 settling down $0.18 to $61.64 despite continued strength in gasoline prices. That rally looks a bit long in the tooth and most likely snaps back 5% or so with the first full percentage point bump in refinery utilization and/or significant rise in gasoline imports.
- Natural gas fell $0.13 to $7.24 on the 102 Bcf withdrawal (actually 90 – see Odds & Ends below). Next week’s number should be bigger with the recent cold snap but gas may still make a run at $7 as traders look towards the slacken demand of the shoulder season and the likelihood of trough storage that is 15 to 16% above the five year average (and down about the same from year ago levels).
So where are we relative to historic levels of gas storage? Note: The EIA made some adjustments to their historic data but have not yet released a new version of the database for download (more on that in Odds & Ends).
- 14% or 268 Bcf below the year ago figure. Last week we were only 12% into YoY territory (239 Bcf) so now the EIA must have taken storage numbers for last spring up.
- We’re now much further above the “new five year average”. At 13.5% or 194 Bcf above the five year average of 1,437 – the five year range appears to have dropped pretty massively in the revision since we were 11% above it last week and we got a bigger withdrawal this week than a year ago. That seems odd.
- EIA says that if demand holds at 5 year average levels for March that trough storage will be at 1,426 Bcf – that’s a little higher than the 1,400 Bcf I expected last week despite a big withdrawal…need to see those new numbers.
Nevertheless I’m starting to think that natural gas prices won’t get the large retrenchment I had once expected. I’d bet on a short term sell off during the shoulder season but then upward pressure from a plethora of sources including everything from budgetary constraints to threatened shut ins to hurricanes to La Nina to falling imports from Canada. So I’m transitioning from bearish to neutral and doing the homework to have long bets in place when/if I feel the time is right.
Does this mean I pull my remaining shorts? No! I’ll scale out over time just like I scaled in. Like I said, I still think there will be a period of seasonally induced natural gas price weakness ahead that could lead to a pretty good washout in my current put names. Then I go to cash and then long.
Here’s a very cursory inspection of the latest gas data as I mull over getting a little bullish. I know it’s shocking since I’ve been bearish since the inception of this blog. For those of you using me as a contrarian indicator (you know who you are!) this is your first and only warning to take profits on longs. Note: service stocks are a different matter and I’m unlikely to get bullish unless they get thrashed this spring as they are earnings momentum animals and they appear to be decelerating (see my note on dissecting the OIH here).
The Near Month Future On This Date In History – Funny how that looks like the broader market.

That seems pretty odd given high storage levels. Like I graphically depicted here storage-vs-price.JPG last Friday, the correlation between price and storage seems to have broken down back in 2003.
Let’s have a cursory look at supply and demand. None of this is really new but it lays out the bull perspective pretty well. Early March is an interesting time to analyze past supply and demand because it’s the first time each year that EIA data gives you a first look at the entirety of the preceding year. Granted the data is subject to revision for quite some time but it’s usually not far off their final numbers.
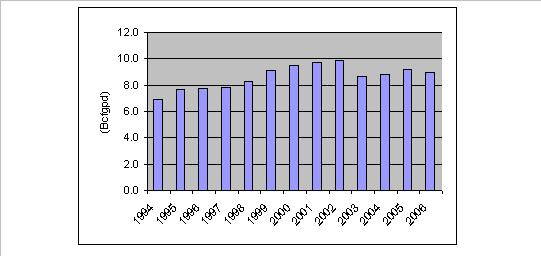
U.S. Annual Gas Production (Bcfgpd)

I’m not bothering with getting this down to dry gas production but am instead just illustrating the point that US gas production is essentially holding flat. It hasn’t been growing but it certainly has not fallen off a cliff. Production may actually increase ever so slightly this year as Shale and non-conventional Rockies growth outpaces reduced output from the Gulf of Mexico.
…And It Has Taken A Rig Count Like This To Simply Maintain Production

Rig count data courtesy Baker Hughes
Other Supply: EIA Still Says LNG Volumes About Skyrocket. According to the EIA: EIA expects total liquefied natural gas (LNG) imports to increase from their 2006 level of 580 Bcf to 770 Bcf in 2007. LNG import projections remain strong for 2008 as well, expanding by 39 percent to exceed the 1 Tcf mark. Comment: That’s an additional 0.5 and 0.8 Bcfgpd in 2007 and 2008 respectively and I’d say that’s pretty gas price bearish but it’s one of the few things you can easily point to beside demand to get real bearish about. I think the analysts will heavily discount rising LNG againsts stories of fall Canadian imports.
Canada: Imports Are Rolling Over Or At Best Not Growing…

…And The Situation Looks Even More Bleak When You Consider The U.S. Volumes Headed North Of The Border Keep Rising.
Net Imports From Canada:
Many analysts are calling for a 1.0 Bcfgpd drop in net imports from Canada as production falls and oil sands projects and domestic demand keep more volumes north of the border. That’s been argued for a long time and while those factors play a role I wouldn’t expect such a dramatic, one year drop as that.
…And Exports To Mexico Have Plateaued At 1.0 Bcfgpd (Pemex really needs to get on the ball!)

U.S. Annual Gas Demand (Bcfgpd)
Meanwhile, annual US demand has been falling. The result of warm winters for sure but also a bit of demand destruction. I’ll go into a bit more detail on this over the weekend but suffice it say that the duration of elevated gas prices has curtailed industrial gas demand (not good for gas demand since Industry is the biggest consumer of gas). This has especially been true in Texas which was once home to nearly one-third of all industrial gas consumption but last year was only good for 21%.

All in all, it’s a mixed bag. Production is flat, imports may fall a tick but are probably going to net out as close to flat between rising LNG and falling Canadian supply and demand appear stuck in neutral. I’m feeling pretty neutral myself. Bearish in the near term but leaning towards the other B word longer term .
Odds & Ends:
Gas Inventory Review: The EIA Pulls A Fast One!
My Expectation Was 75 Bcf, Well Below the 102 “Reported”. I was no doubt low but there were mitigating circumstances to the EIA’s 102 number. The EIA included a 12 Bcf adjustment in the numbers.
- Before yesterday’s report came out, the EIA had indicated that this time last year we had 1,887 Bcf in storage. And the storage withdrawal in the year ago week was 85 Bcf (the guy on CNBC just after the report thought so as well).
- Now the data shows year ago storage of 1,899 Bcf, 12 Bcf higher. The EIA has a habit of periodically adjusting their historical data without really commenting on it. So the real number for yesterday is 90+ a balancing adjustment of 12 Bcf so I still missed but not as bad as I thought. The EIA database still shows the old numbers relative to yesterday’s summary report.
Posted in Uncategorized | 22 Comments »
Endeavour Petroleum – One Interesting Little Minnow
Posted by zmann on March 8, 2007
As a rule, I don’t buy single-digit-midget stocks. Single digit stocks tend to either: 1) stay that way slowly wasting away in your portfolio for years, or 2) pop up quickly, convincing you how smart you really are (in which case you hold it forever thinking you will get even “smarter”). Then, after you’ve doubled down and told all your friends about it, the bottom generally falls out of the story and you have to find a whole new set of drinking buddies.
The reason for this phenomenon is that most micro caps lack one or both of the following: 1) strong (disciplined and experiened) management and 2) a plan and the wherewithal (money and physical assets) to carry it out (which kind of gets back to #1).
Enter Endeavour International, END on the Amex. Not Your Typical $2 Player.
END is a relatively new, pure North Sea E&P player transitioning from startup to self sustaining concern.
Management:
Bill Transier – former CFO at Ocean Energy which gobbled up Seagull in 1999 and then was itself consumed by DVN in 2003. That’s a lot of big player offshore expertise. I’ve sat across the table from Bill and Jim Hackett when they ran Ocean and they’re what you’d call serious oil men. No glitz. Very savvy. Everything by the numbers. Mr Hackett left Devon to run Anadarko. Mr Transier went to END.
John Seitz – former CEO, COO, President of Anadarko. Now heading up the geology team co-founder and vice-chairman of the board of END.
Management also contains seasoned professionals from APC and Seagull so the team is strong and has lots of offshore experience.
32 geologists, geophysicists, and engineers as of year end 2006.
The Plan:
The Concept Isn’t New: Fish where the Majors don’t care to and exploit their old finds while doing a little step out exploration. END was formed with that specific purpose in mind unlike other E&Ps who now participate in the North Sea as a sideline business.
Organic Production Growth Is Just Over The Horizon…
2007 will show a big jump in production (200+%) from acquisitions made in 2006. That’s not the interesting part as it’s basically just acquired volumes.
However, the 2008 to 2010 period will begin to show the fruits of exploratory and development drilling building upon those acquisitions as production again grows roughly 50% from discoveries that have already been made. They are about to drill another significant exploratory test with results expected during 2Q07 giving a potential near term catalyst to the story.
Production Base:
- Norway: Two fields: END holds small interests in two Norwegian offshore fields: Njord and Brage – 4Q06 production (~ 1,400 boepd)
- Central North Sea
- Bought seven producing fields and associated non-producing assets, the “Talisman purchase”, for $414 million during 4Q06.
- producing 8,800 boepd at close of acquisition in October.
- 18 mm boe proved reserves as of YE05.
- Rochelle discovery (55.6% interest) – see below.
- On the surface the ~ $23/barrel purchase price seems pretty high…the Rochelle discovery (net 2.7 mm boe) and the other non-producing assets must have added significantly to the bid. (net 2.7 mm bls), probably 3,000 boepd net by late 2009
- Total current production ~ 10,000 boepd (as of March 6, 2007)
Full year guidance is 8,800 to 9,200 boepd. Note the expected decline is pretty steep as they’re currently producing 10 mboepd and they just bought roughly 90% of that last Fall.
Reserves:
- 2006: 29.6 mm boe (via drill bit: 2 exploratory discoveries and the “Talisman purchase”), up nearly five fold from 6.3 mm boe at the end of 2005.
- F&D: pretty high for my book. Last year’s straight line acquisition F&D was $23/barrel.
Exploration Has Been Pretty Fruitful So Far:
- 2006: END was 2.5 for 3.
- Cygnus – shallow water (65′) gas discovery, 12.5% working interest
- 3 fault blocks – 40 Bcf net P50 total (6.7 mm boe)
- Company estimates discovery fault block one yields 10 mmcfgpd net (1,666 boepd) by mid 2008. Additional 2 FBs could boost production by an incremental net 2,000+ boepd by 2010.
- Plan one development well by end 2007.
- Columbus – gas discovery, 25% WI, the well encountered a liquids rich gas column that tested 17.5 mmcfgpd and 1,060 barrels of condensate per day (994 boepd net before royalties).
- Appraisal well scheduled for later this year.
- Bacchus – 10%, not definitive, not P&A’d either (this is the half).
- Cygnus – shallow water (65′) gas discovery, 12.5% working interest
- 2007: The company operates a test of the Balgownie Prospect set to spud 2Q07. END has a 60% interest (although that may dilute a bit prior to drilling) in this:
- 4 way dip closure with gross estimated reserves of 57 mm boe (if it works out to its full potential the net reserves would be obviously substantial given the END’s current reserves of 29 mm boe).
- Good quality 2D and 3D over the structure,
- High porosity and permeability exist in the targeted sand (Fulmar) in multiple nearby fields,
- where hydrocarbon columns in excess of 900 feet have been found.
- This should spud during May 2007 and take about 35 days to reach TD. (so we probably know something mid to late June). Note: I had originally penciled this one in as a March end spud and April TD but it got pushed back to due to rig availability.
- There’s a second, smaller prospect (Cullen) on the east part of the that probably gets more attention if Balgownie is succesful.
Development:
- Rochelle – (a discovery that was never developed and was acquired in the Talisman purchase), 55.6% WI, plan to drill a development well and tieback to an existing FSU in late 2008. On a net basis it probably adds about 3,000 Boepd.
Production Growth Chart
 If a picture is worth a thousand words I don’t need to write too much about the preceding table. It pretty much tells the story out through 2010.
- Note the yellow wedge at the bottom that is END’s Norweigian production. See how it creeps up over time. That’s an expectation that their exploitation and workover activity will arrest field declines and ultimately revitalized production growth.
- Note also that despite the fact that production declines of 10 to 20% per field will result in production falling to just over 8,000 boepd before the development of new discoveries drive production over 12,000 boepd.
Summary: Seasoned management team, improving production profile and thereby financials, and the potential to keep increasing reserves at double-digit rates. This is another one I plan to buy (around $2 and forget about for a time) and forget about for awhile but of course, there’s no rush here; do your own DD, I could be wrong.
Street Coverage: No coverage with clout at this point. Despite at least one bulge bracket firm and a handful of smaller brokerages the shares have been dead money for months. At present 4 of the 6 covering firms have buys or strong buys on the shares.
Posted in Uncategorized | 13 Comments »
